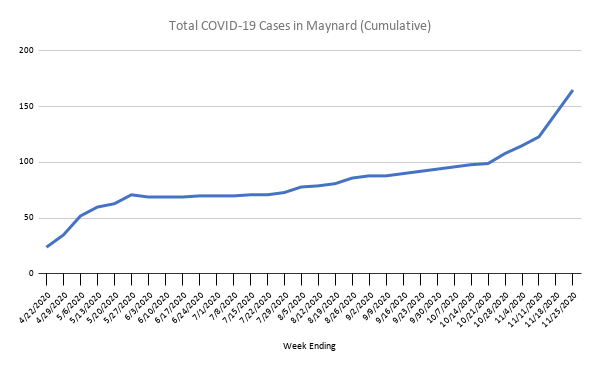
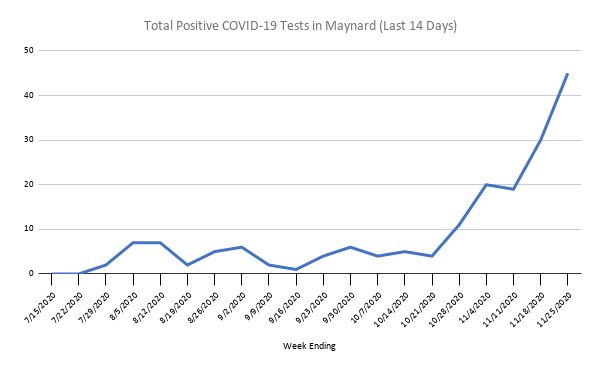
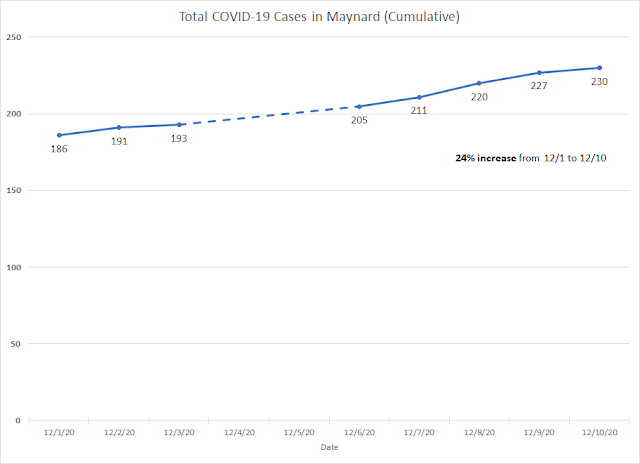
Weekly COVID-19 Data for Maynard, MA - Through 11/25/20
Welcome to my blog! I created this blog just to more easily share COVID-19 data for my little community of Maynard, MA. I'll be updating these graphs* as new data is made available, which is usually on Fridays. I did not calculate any of the statistics shown - they come directly from the Commonwealth's COVID-19 Weekly Public Health Report. I simply copied the data into Excel and made the graphs there, then saved them as images.
Please feel free to ask me any questions - I have a MSPH in Epidemiology, FWIW. But the bottom line is that these trends are NOT good. 😟 My hope is that when people here in Maynard see these graphs, they will take the pandemic more seriously. I implore everyone to wear masks, practice social distancing, use hand sanitizer, and keep your covid "bubbles" as small as possible. Thank you! 😷🙏
*The reason that the start dates differ among the graphs is that Massachusetts didn't start tracking all of these metrics at the same time. I always used the earliest weekly report available for each metric.


Comments
Post a Comment