Posts

Showing posts from December, 2020

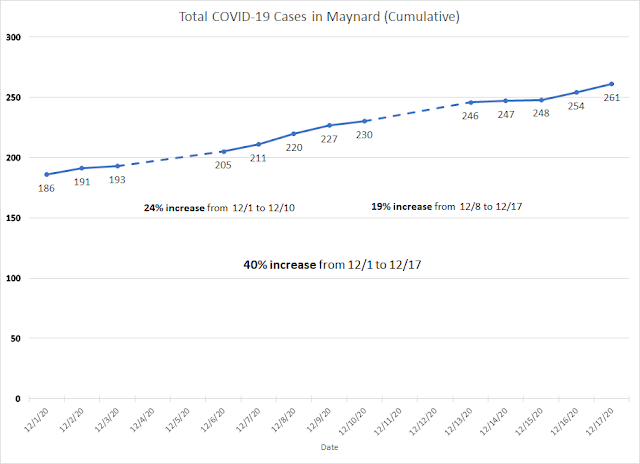
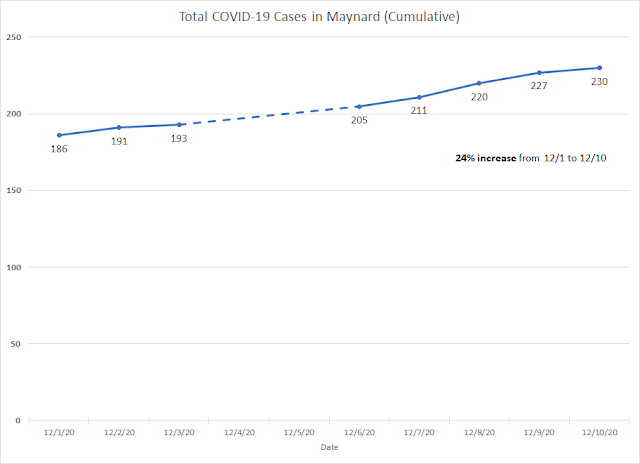
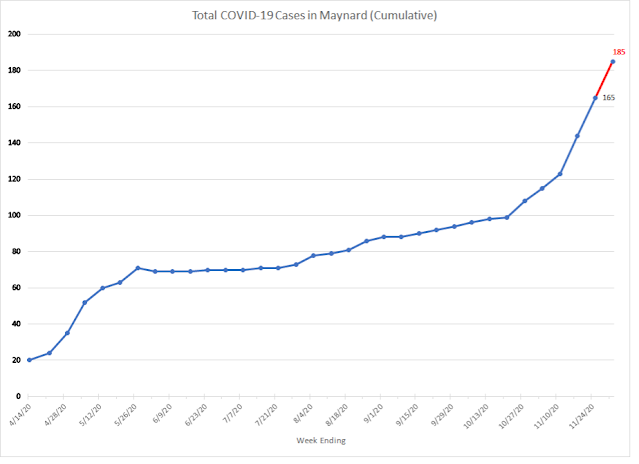
COVID-19 Data for Maynard, MA - Weekly Through 12/22/20, Daily Through 12/28/20

Image
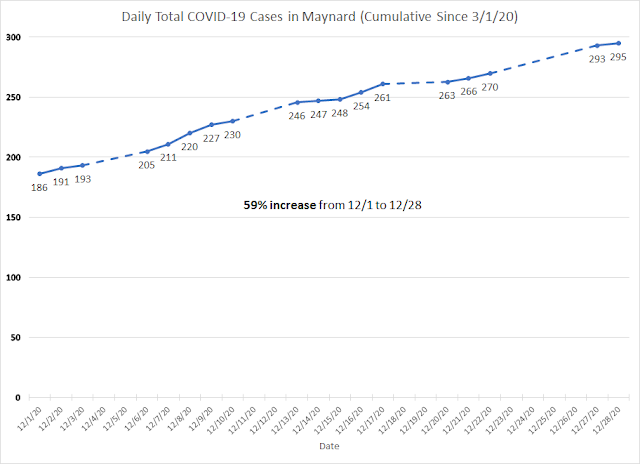
My fellow Maynardians, I sincerely apologize for the delay - I usually post on Saturday or Sunday, but I was feeling a bit down from spending the holidays alone, so I needed a break from social media*.   Unfortunately, as you'll see from the graphs below, the pandemic has not taken a break, and I am extremely worried about what is to come in the weeks ahead, especially now that the more contagious U.K. strain has been identified in the U.S.    Dr. Fauci and the CDC begged and pleaded with people not to travel or spend the holidays with people outside their covid bubble, however, the TSA reported that this past Sunday (12/27) was the busiest day for flying since the pandemic began .  I want to thank those of you who did heed the public health warnings - it may not feel as if it makes much of a difference, but collectively, when each of us makes this sacrifice, it does have a positive impact on public health. Maynard's percent positivity is holding steady at just a hair below 5%,

Weekly COVID-19 Data for Maynard, MA - Through 12/15/20

Image
My fellow Maynardians: we are continuing to go in the wron g direction. 😟  If our percent positivity rate goes much higher, we will be categorized by the MA Dept. of Public Health as a red   community (the threshold is 5% and we are at 4.84%).  From just December 1st to the 17th, our cumulative cases have increased by 40%. While a small number of people have started getting vaccinated, it's going to take at least until at summer or fall to achieve herd immunity (and that's assuming enough people get vaccinated, and that immunity lasts long enough, among other factors).  I'm not trying to be a debbie downer, but this is no time to celebrate and let our guard down. If you are considering traveling for the holidays and/or spending them with people outside your covid bubble, please take a look at these graphs and really think about the risk you are putting yourself and others in. And whatever you do, please wear a mask, maintain social distance, and wash your hands! Thank you!

Weekly COVID-19 Data for Maynard, MA - Through 12/8/20

Image
I'm starting to get scared of the trends here in Maynard.  If the trend of skyrocketing covid in the Boston area wastewater is any indication of what could be happening here in Maynard, the shit is really gonna hit the fan soon.  Positive covid tests tend to show up anywhere from 4 to 10 days after covid is detected in wastewater. I've also started graphing the daily* cumulative cases in Maynard - since the data is not archived, and I only started tracking it on December 1st, the graph starts at that date.  There has been a 24% increase in cumulative cases in just 10 days (from 12/1 to 12/10)!  If that fact doesn't put things into perspective, I'm not sure what will.  Please stay safe, everyone.  And share this widely - if this blog can help just one person take this pandemic more seriously, then I've done my job. *The town does not publish updates on weekends. I am aware that there are minor discrepancies between the daily and weekly counts, which could be due to

Weekly COVID-19 Data for Framingham, MA - Through 12/1/20

Image
By request, here are the COVID-19 graphs for the city of Framingham.  These trends are not looking good.  Please share widely.  I'm not sure why, but instead of the usual 7 days of data, this update only contains  6 more days of data.  Due to Excel being, well, Excel, I had to put 12/2/20 as the value for the x-axis (instead of the true value of 12/1/20) in order for the date to show up.  I don't know whether the next update will include 7 days of data, or 8 days, to make up for this discrepancy.  I guess we'll find out by the end of the week when the state releases its next update.

Weekly COVID-19 Data for Northborough, MA - Through 12/1/20

Image
By request, here are the COVID-19 graphs for Northborough.  These trends are not looking good.  Please share widely.  I'm not sure why, but instead of the usual 7 days of data, this update only contains  6 more days of data.  Due to Excel being, well, Excel, I had to put 12/2/20 as the value for the x-axis (instead of the true value of 12/1/20) in order for the date to show up.  I don't know whether the next update will include 7 days of data, or 8 days, to make up for this discrepancy.  I guess we'll find out by the end of the week when the state releases its next update.

Weekly COVID-19 Data for Melrose, MA - Through 12/1/20

Image
By request, here are the COVID-19 graphs for the city of Melrose.  These trends are not looking good.  Please share widely. I'm not sure why, but instead of the usual 7 days of data, this update only contains  6  more days of data.  Due to Excel being, well, Excel, I had to put 12/2/20 as the value for the x-axis (instead of the true value of 12/1/20) in order for the date to show up.  I don't know whether the next update will include 7 days of data, or 8 days, to make up for this discrepancy.  I guess we'll find out by the end of the week when the state releases its next update.

Weekly COVID-19 Data for Maynard, MA - Through 12/1/20

Image
I'm not sure why, but instead of the usual 7 days of data, this update only contains 6 more days of data.  Due to Excel being, well, Excel, I had to put 12/2/20 as the value for the x-axis (instead of the true value of 12/1/20) in order for the date to show up.  I don't know whether the next update will include 7 days of data, or 8 days, to make up for this discrepancy.  I guess we'll find out by the end of the week when the state releases its next update. Cases continue to rise (we're actually now at 205 as of yesterday - I will start graphing the daily data soon), but more concerning is the continued rise in % positivity.  We can expect it to increase further because increasing amounts of covid-19 are showing up in the wastewater in the Greater Boston area .  I wouldn't focus too much on the slight drop in the 14-day positive tests or incidence rate, esp. because testing was erratic right after Thanksgiving...though if it drops again in the next update, we might

Weekly COVID-19 Data for Maynard, MA - Through 11/25/20

Image
Welcome to my blog!  I created this blog just to more easily share COVID-19 data for my little community of Maynard, MA.  I'll be updating these graphs* as new data is made available, which is usually on Fridays.  I did not calculate any of the statistics shown - they come directly from the Commonwealth's COVID-19 Weekly Public Health Report .  I simply copied the data into Excel and made the graphs there, then saved them as images. Please feel free to ask me any questions - I have a MSPH in Epidemiology, FWIW.  But the bottom line is that these trends are NOT good. 😟  My hope is that when people here in Maynard see these graphs, they will take the pandemic more seriously.  I implore everyone to wear masks, practice social distancing, use hand sanitizer, and keep your covid "bubbles" as small as possible.  Thank you! 😷🙏 *The reason that the start dates differ among the graphs is that Massachusetts didn't start tracking all of these metrics at the same time.  I