Posts

COVID-19 Data for Maynard, MA - Weekly Through 1/5/21, Daily Through 1/10/21

Image
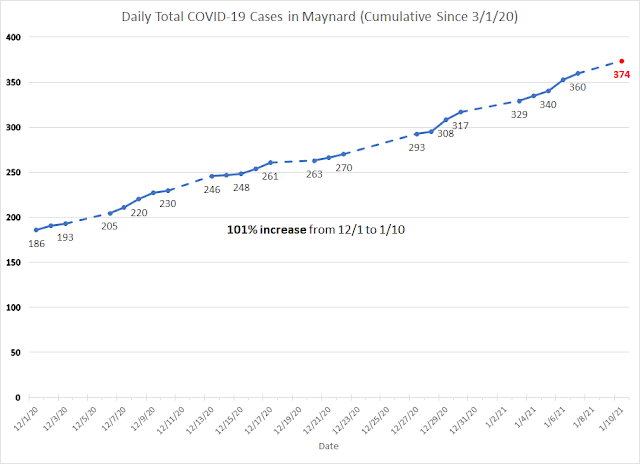
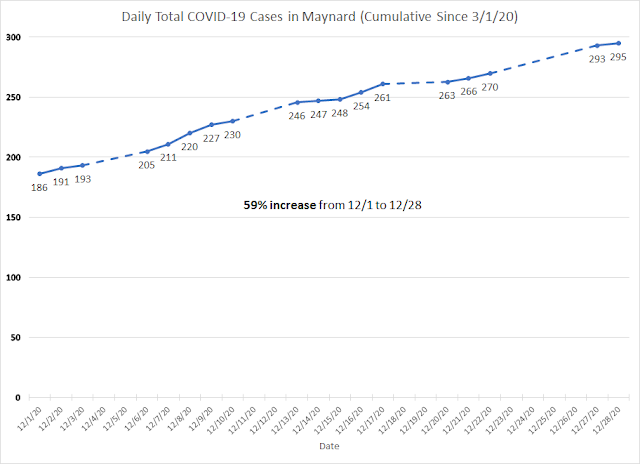
❗ ❗ ❗ ❗ ❗ RED ALERT   ❗ ❗ ❗ ❗ ❗ Congratulations, Maynard.  We are now in the " red " due to our percent positivity hitting (and exceeding) 5%.  In fact, in just one week, our % positivity jumped from 4.80% to 7.81%!  Another fun fact is that the cumulative number of confirmed covid-19 cases in Maynard has doubled  since December 1st.  To put it another way, it took 9 months for Maynard to reach 186 cases, but less than 6 weeks for Maynard to gain another 186 cases (and in fact, it was 188 but who's counting)! This was both completely predictable AND completely avoidable.  People traveled over the holidays, had parties, and I see more and more people walking around maskless and in groups.  Pardon my French, but I am fucking angry.  Do people not understand that if these trends continue, we are going to run out of capacity at hospitals, particularly ICU beds ?!  Things are going to get worse before they get better -  listen to Dr. Fauci.   And please, for the love of dog

COVID-19 Data for Maynard, MA - Weekly Through 12/22/20, Daily Through 12/28/20

Image
My fellow Maynardians, I sincerely apologize for the delay - I usually post on Saturday or Sunday, but I was feeling a bit down from spending the holidays alone, so I needed a break from social media*.   Unfortunately, as you'll see from the graphs below, the pandemic has not taken a break, and I am extremely worried about what is to come in the weeks ahead, especially now that the more contagious U.K. strain has been identified in the U.S.    Dr. Fauci and the CDC begged and pleaded with people not to travel or spend the holidays with people outside their covid bubble, however, the TSA reported that this past Sunday (12/27) was the busiest day for flying since the pandemic began .  I want to thank those of you who did heed the public health warnings - it may not feel as if it makes much of a difference, but collectively, when each of us makes this sacrifice, it does have a positive impact on public health. Maynard's percent positivity is holding steady at just a hair below 5%,

Weekly COVID-19 Data for Maynard, MA - Through 12/15/20

Image
My fellow Maynardians: we are continuing to go in the wron g direction. 😟  If our percent positivity rate goes much higher, we will be categorized by the MA Dept. of Public Health as a red   community (the threshold is 5% and we are at 4.84%).  From just December 1st to the 17th, our cumulative cases have increased by 40%. While a small number of people have started getting vaccinated, it's going to take at least until at summer or fall to achieve herd immunity (and that's assuming enough people get vaccinated, and that immunity lasts long enough, among other factors).  I'm not trying to be a debbie downer, but this is no time to celebrate and let our guard down. If you are considering traveling for the holidays and/or spending them with people outside your covid bubble, please take a look at these graphs and really think about the risk you are putting yourself and others in. And whatever you do, please wear a mask, maintain social distance, and wash your hands! Thank you!

Weekly COVID-19 Data for Maynard, MA - Through 12/8/20

Image
I'm starting to get scared of the trends here in Maynard.  If the trend of skyrocketing covid in the Boston area wastewater is any indication of what could be happening here in Maynard, the shit is really gonna hit the fan soon.  Positive covid tests tend to show up anywhere from 4 to 10 days after covid is detected in wastewater. I've also started graphing the daily* cumulative cases in Maynard - since the data is not archived, and I only started tracking it on December 1st, the graph starts at that date.  There has been a 24% increase in cumulative cases in just 10 days (from 12/1 to 12/10)!  If that fact doesn't put things into perspective, I'm not sure what will.  Please stay safe, everyone.  And share this widely - if this blog can help just one person take this pandemic more seriously, then I've done my job. *The town does not publish updates on weekends. I am aware that there are minor discrepancies between the daily and weekly counts, which could be due to

Weekly COVID-19 Data for Framingham, MA - Through 12/1/20

Image
By request, here are the COVID-19 graphs for the city of Framingham.  These trends are not looking good.  Please share widely.  I'm not sure why, but instead of the usual 7 days of data, this update only contains  6 more days of data.  Due to Excel being, well, Excel, I had to put 12/2/20 as the value for the x-axis (instead of the true value of 12/1/20) in order for the date to show up.  I don't know whether the next update will include 7 days of data, or 8 days, to make up for this discrepancy.  I guess we'll find out by the end of the week when the state releases its next update.

Weekly COVID-19 Data for Northborough, MA - Through 12/1/20

Image
By request, here are the COVID-19 graphs for Northborough.  These trends are not looking good.  Please share widely.  I'm not sure why, but instead of the usual 7 days of data, this update only contains  6 more days of data.  Due to Excel being, well, Excel, I had to put 12/2/20 as the value for the x-axis (instead of the true value of 12/1/20) in order for the date to show up.  I don't know whether the next update will include 7 days of data, or 8 days, to make up for this discrepancy.  I guess we'll find out by the end of the week when the state releases its next update.

Weekly COVID-19 Data for Melrose, MA - Through 12/1/20

Image
By request, here are the COVID-19 graphs for the city of Melrose.  These trends are not looking good.  Please share widely. I'm not sure why, but instead of the usual 7 days of data, this update only contains  6  more days of data.  Due to Excel being, well, Excel, I had to put 12/2/20 as the value for the x-axis (instead of the true value of 12/1/20) in order for the date to show up.  I don't know whether the next update will include 7 days of data, or 8 days, to make up for this discrepancy.  I guess we'll find out by the end of the week when the state releases its next update.